What is Agnost AI? An MCP server analytics platform
Agnost provides analytics for MCP servers, tracking tool invocations, latency, errors, and user journeys across Claude Desktop, VS Code, and other AI clients.
Model Context Protocol (MCP) servers enable LLMs to interact with external data sources, APIs, and tools. As these servers are deployed across development teams and production environments, a question emerges: how do you understand what's actually happening inside them?
This article examines Agnost AI, an analytics platform that provides visibility into MCP servers with just one line of code.
Understanding MCP server behavior
MCP servers act as middleware between AI models and the tools they need to invoke. When an LLM in Claude Desktop, Cursor, or ChatGPT needs to read a file, query a database, or call an API, it does so through an MCP server.
Without instrumentation, questions like "Which tools are users actually invoking?", "What's causing that latency spike?", and "Why did this tool call fail?" become difficult to answer.
Tool invocations happen asynchronously, user journeys span multiple sessions across different AI clients, and errors can be buried in LLM context windows. Agnost provides purpose-built observability for these patterns.
How Agnost AI works
Agnost takes a lightweight approach to MCP analytics. Rather than requiring extensive configuration or invasive instrumentation, it wraps your existing MCP server with a single function call.
Here's the complete integration for a Python MCP server:
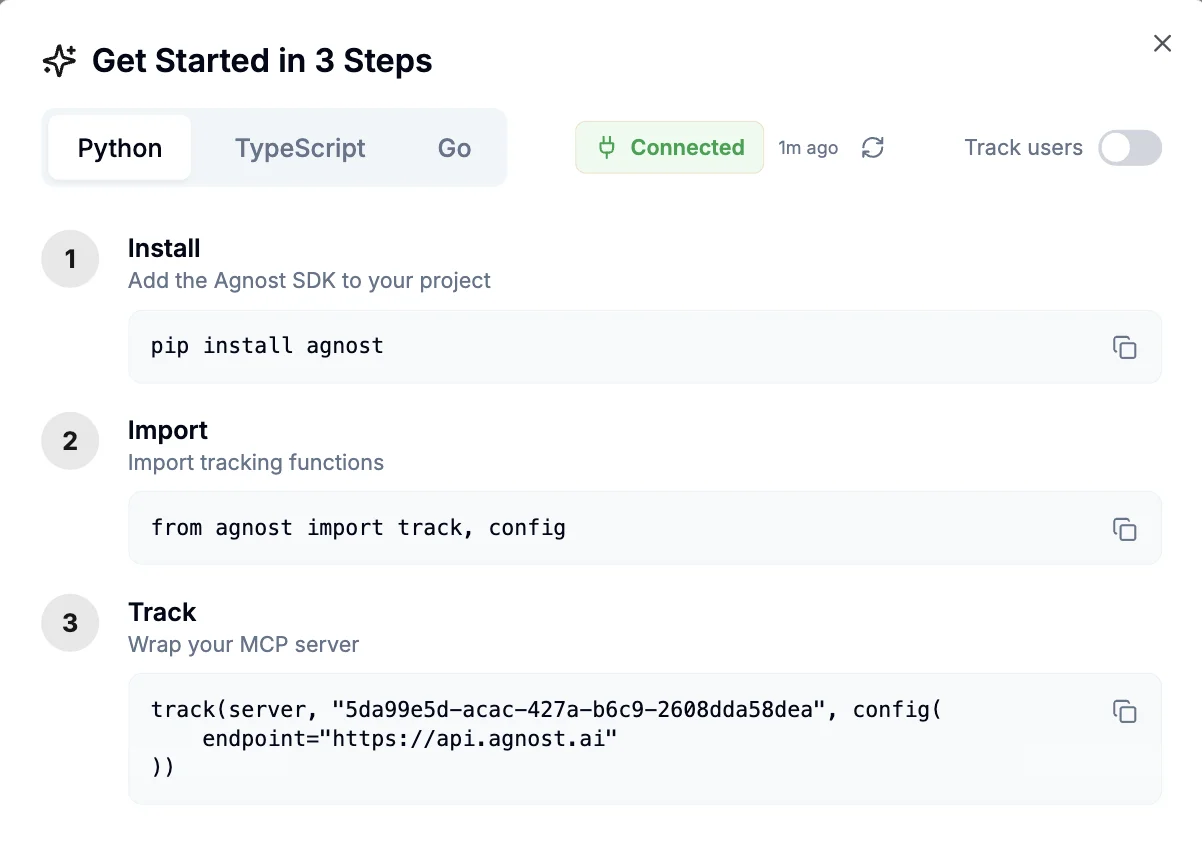
from agnost import track, config
# Initialize with your organization ID

agnost_config = config(endpoint="https://api.agnost.ai")

# Wrap your MCP server
track(server, "your-org-id", agnost_config)Once instrumented, Agnost captures tool invocations, tracks latency, monitors errors, and builds user profiles without modifying your existing server logic.
The SDK sends telemetry data to Agnost's analytics backend, where it's processed and made available through a unified dashboard. Because Agnost understands the MCP protocol, it can extract metrics specific to tool calls.
Why MCP analytics matter
Understanding usage patterns
The Tool Call Statistics view shows which tools are invoked most frequently, helping teams prioritize optimization efforts and identify underutilized capabilities.
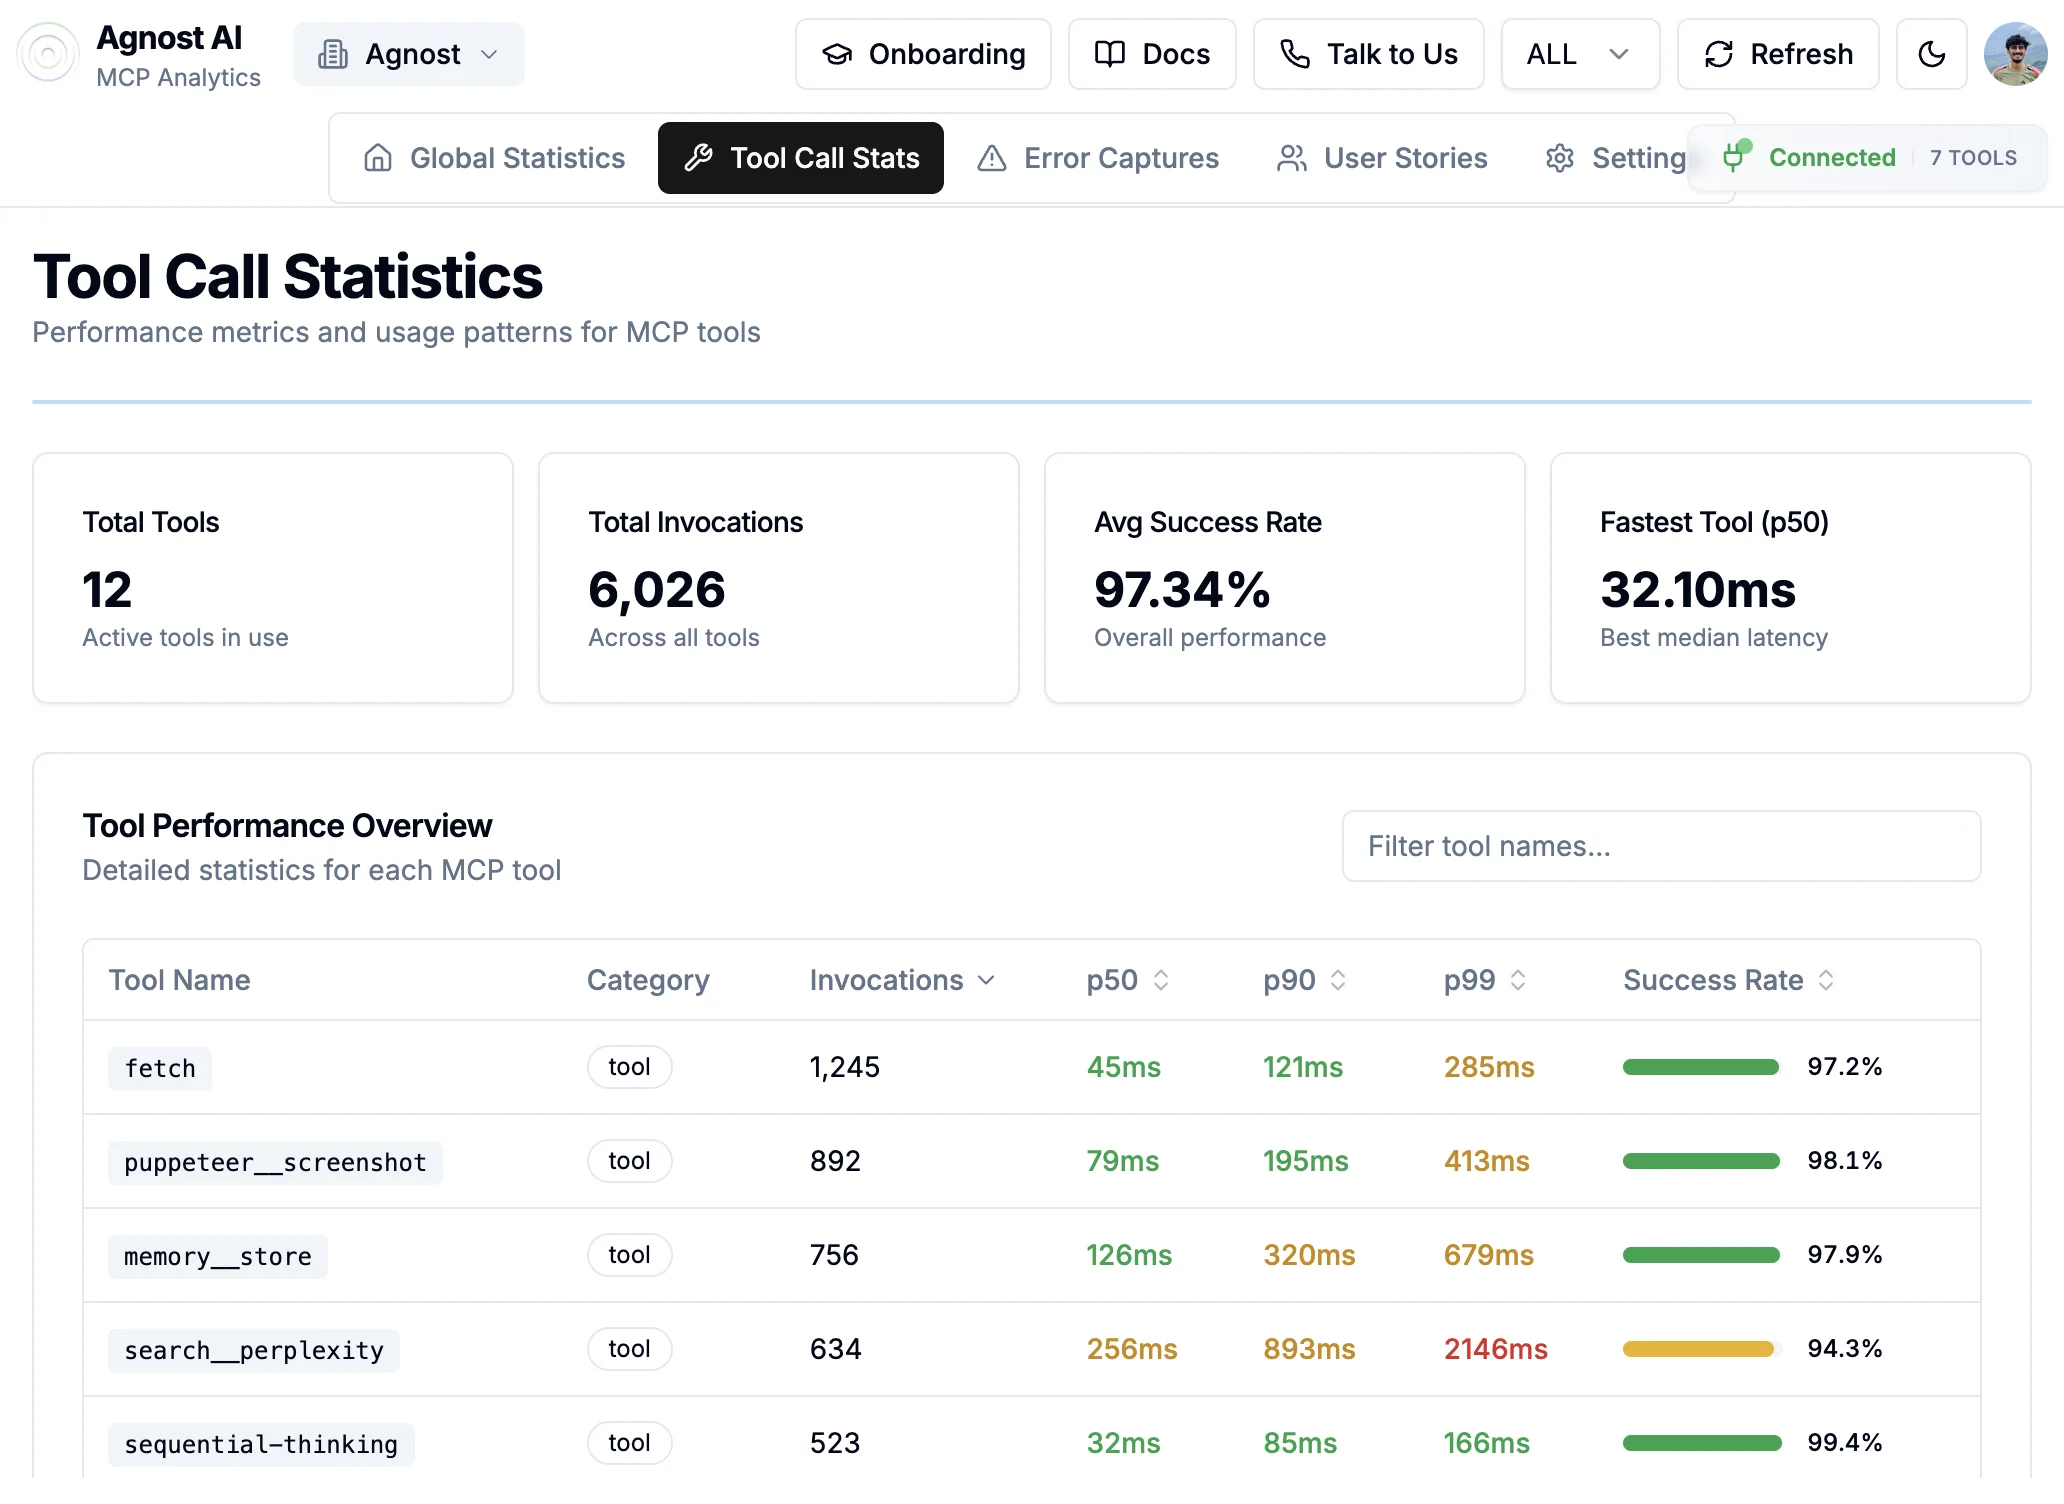
In the dashboard, you can see metrics like total invocations (6,026 in the example), average success rate (97.34%), and performance percentiles (p50, p90, p99) for each tool.
Performance optimization
When an LLM is waiting on a tool call, the user experience is blocked. Agnost tracks latency at multiple percentiles, making it easier to identify slow tools and performance regressions.
The Tool Performance Overview shows color-coded latency bands—green for fast (32ms p50), yellow for moderate (256ms p50), and red for slow (2146ms p99).
Error detection and diagnosis
Agnost's Error Captures view categorizes errors by type and frequency, showing which issues are affecting users most.
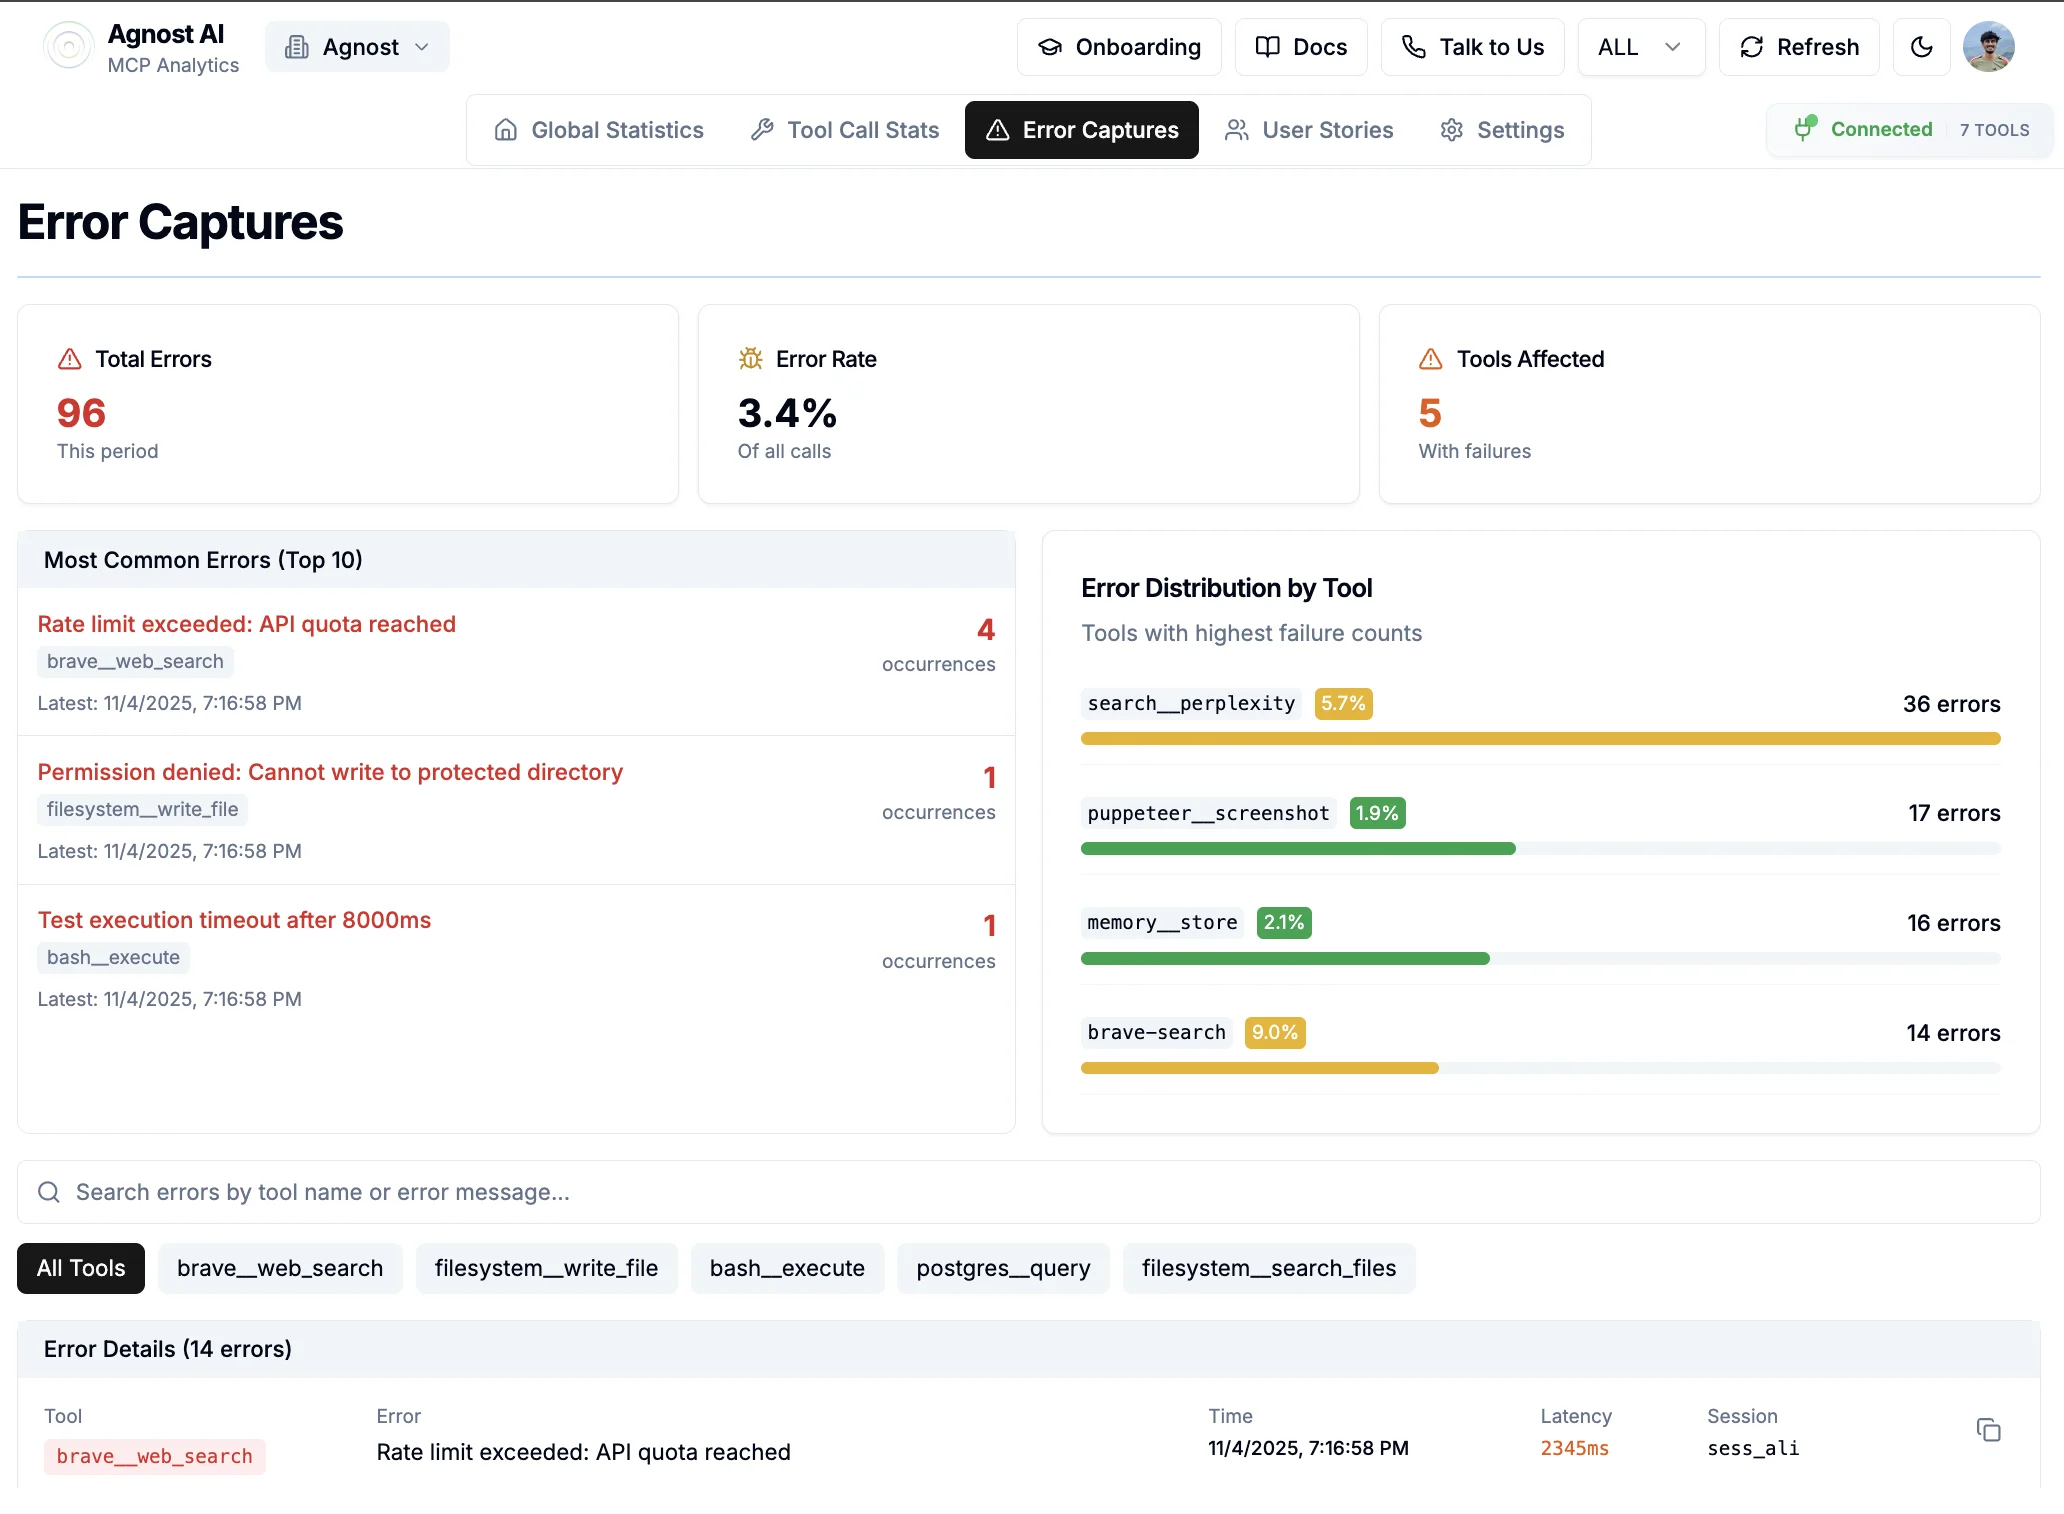
The platform tracks:
User journey visualization
MCP servers often serve multiple users across different AI clients—some in Claude Desktop, others in VS Code, others through the API. Agnost's User Stories view reconstructs individual user journeys, showing the sequence of tool calls, their latency, and their success or failure.
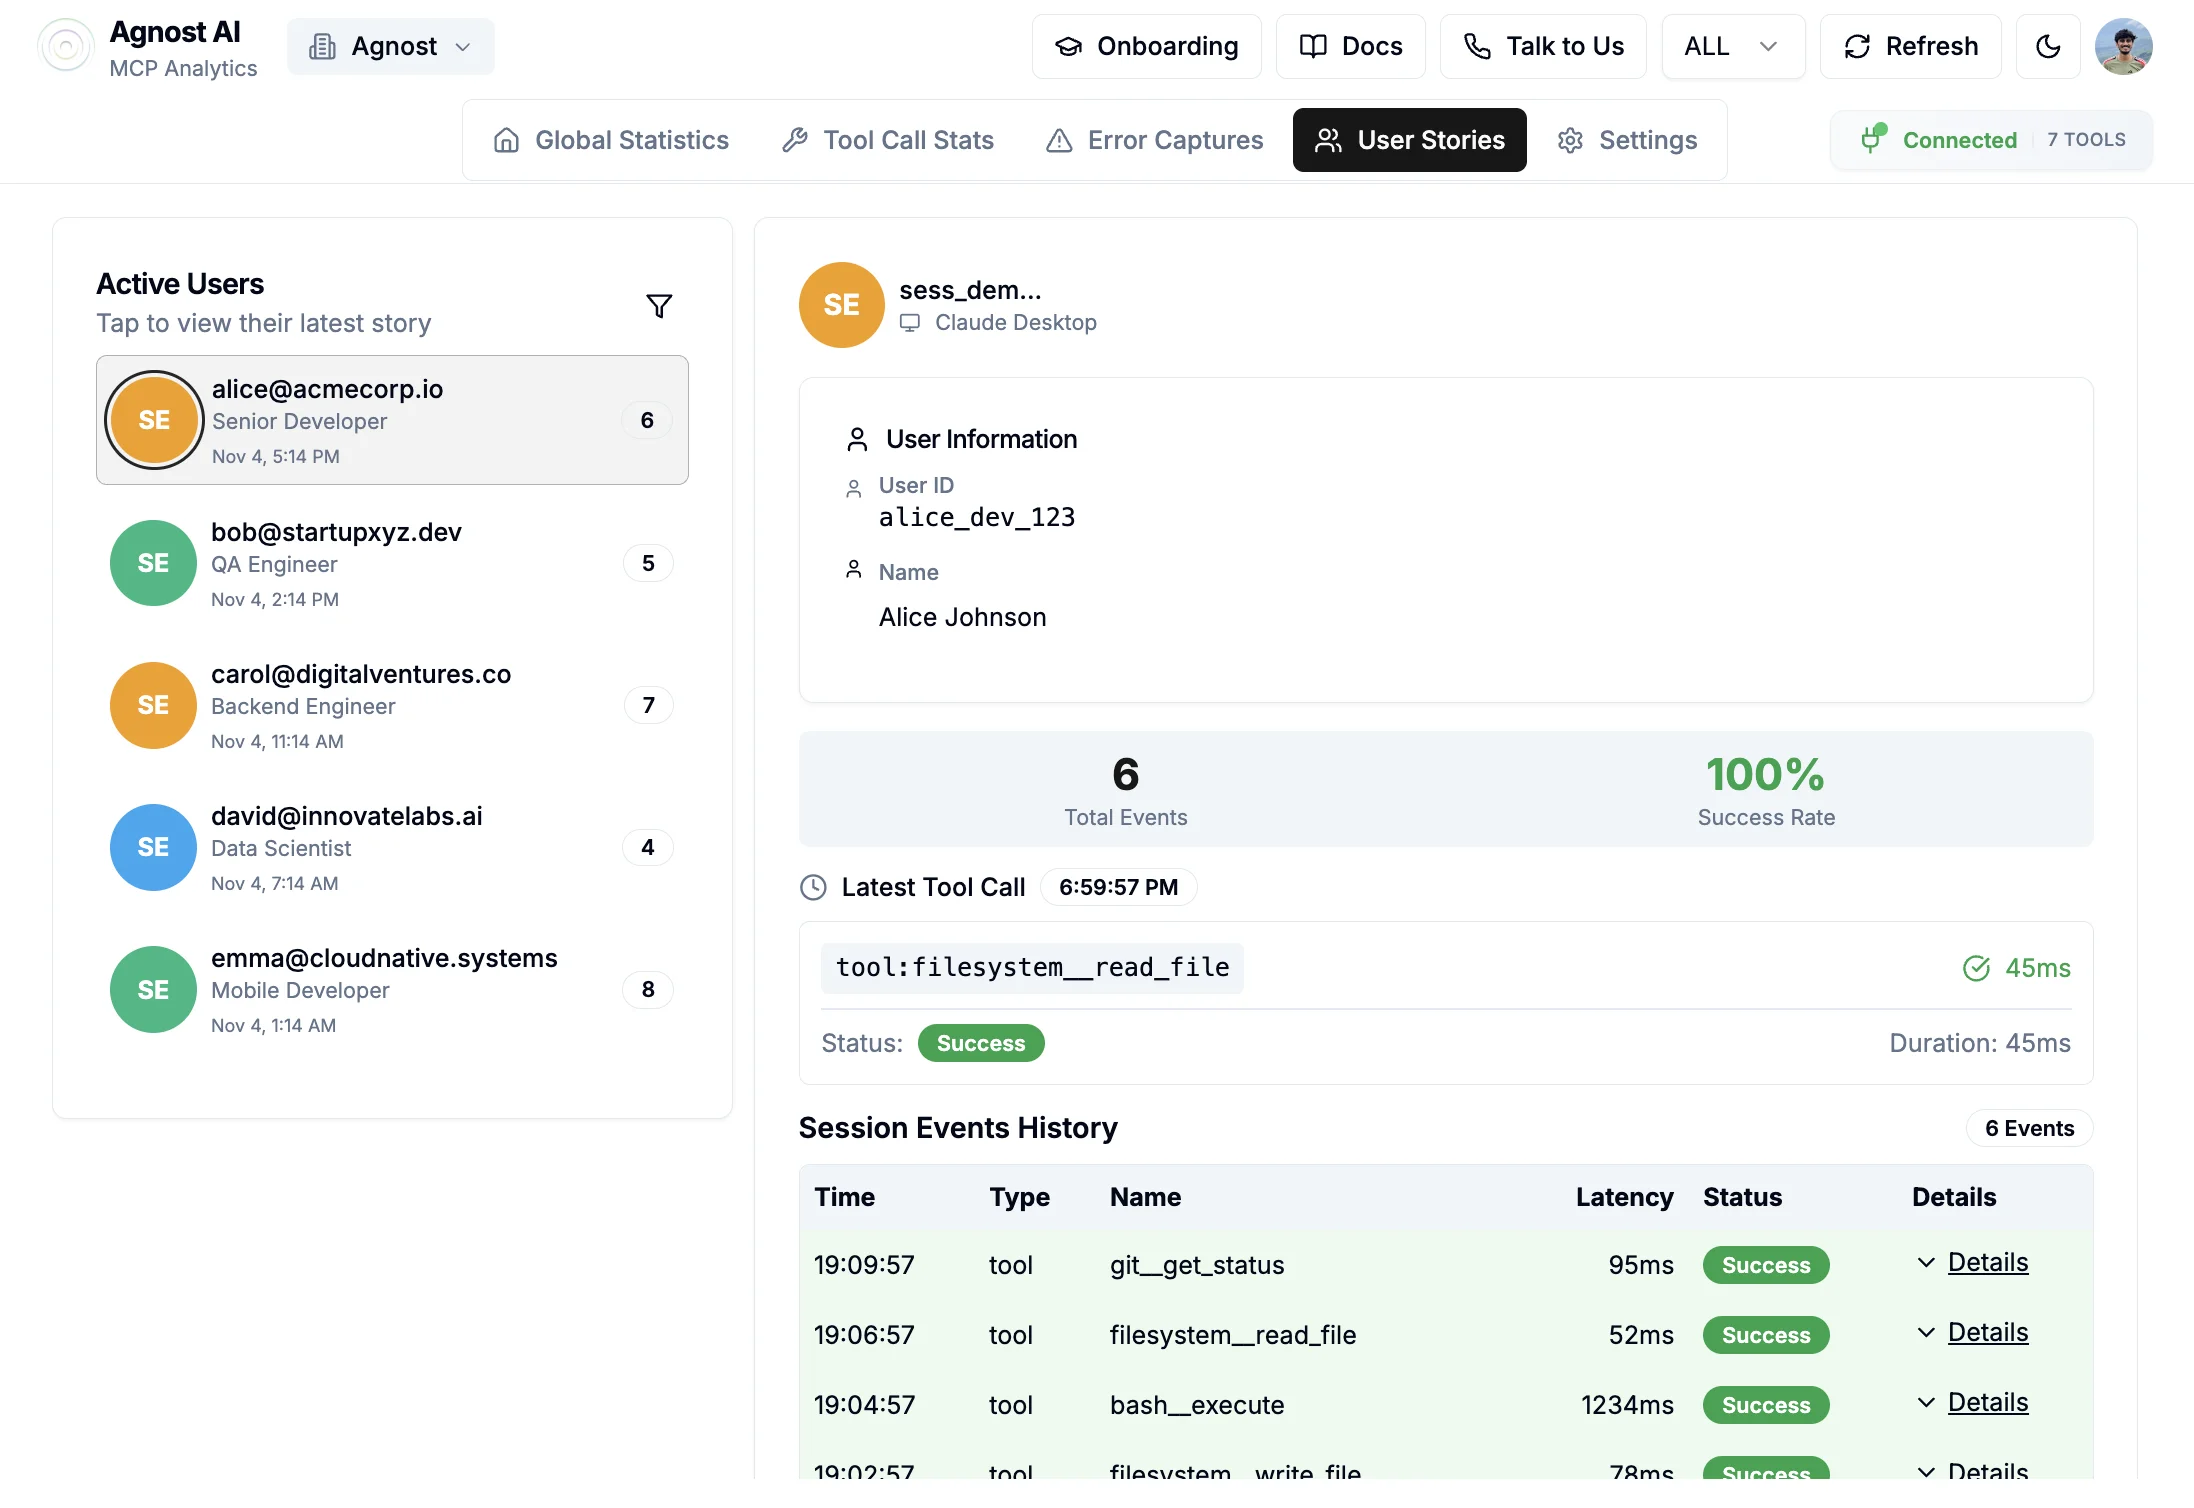
You can track users by ID (like alice_dev_123), see their total events (6), overall success rate (100%), and drill into specific sessions. Each session shows a detailed event history with timestamps, making it possible to debug complex multi-tool interactions.
Client distribution insights
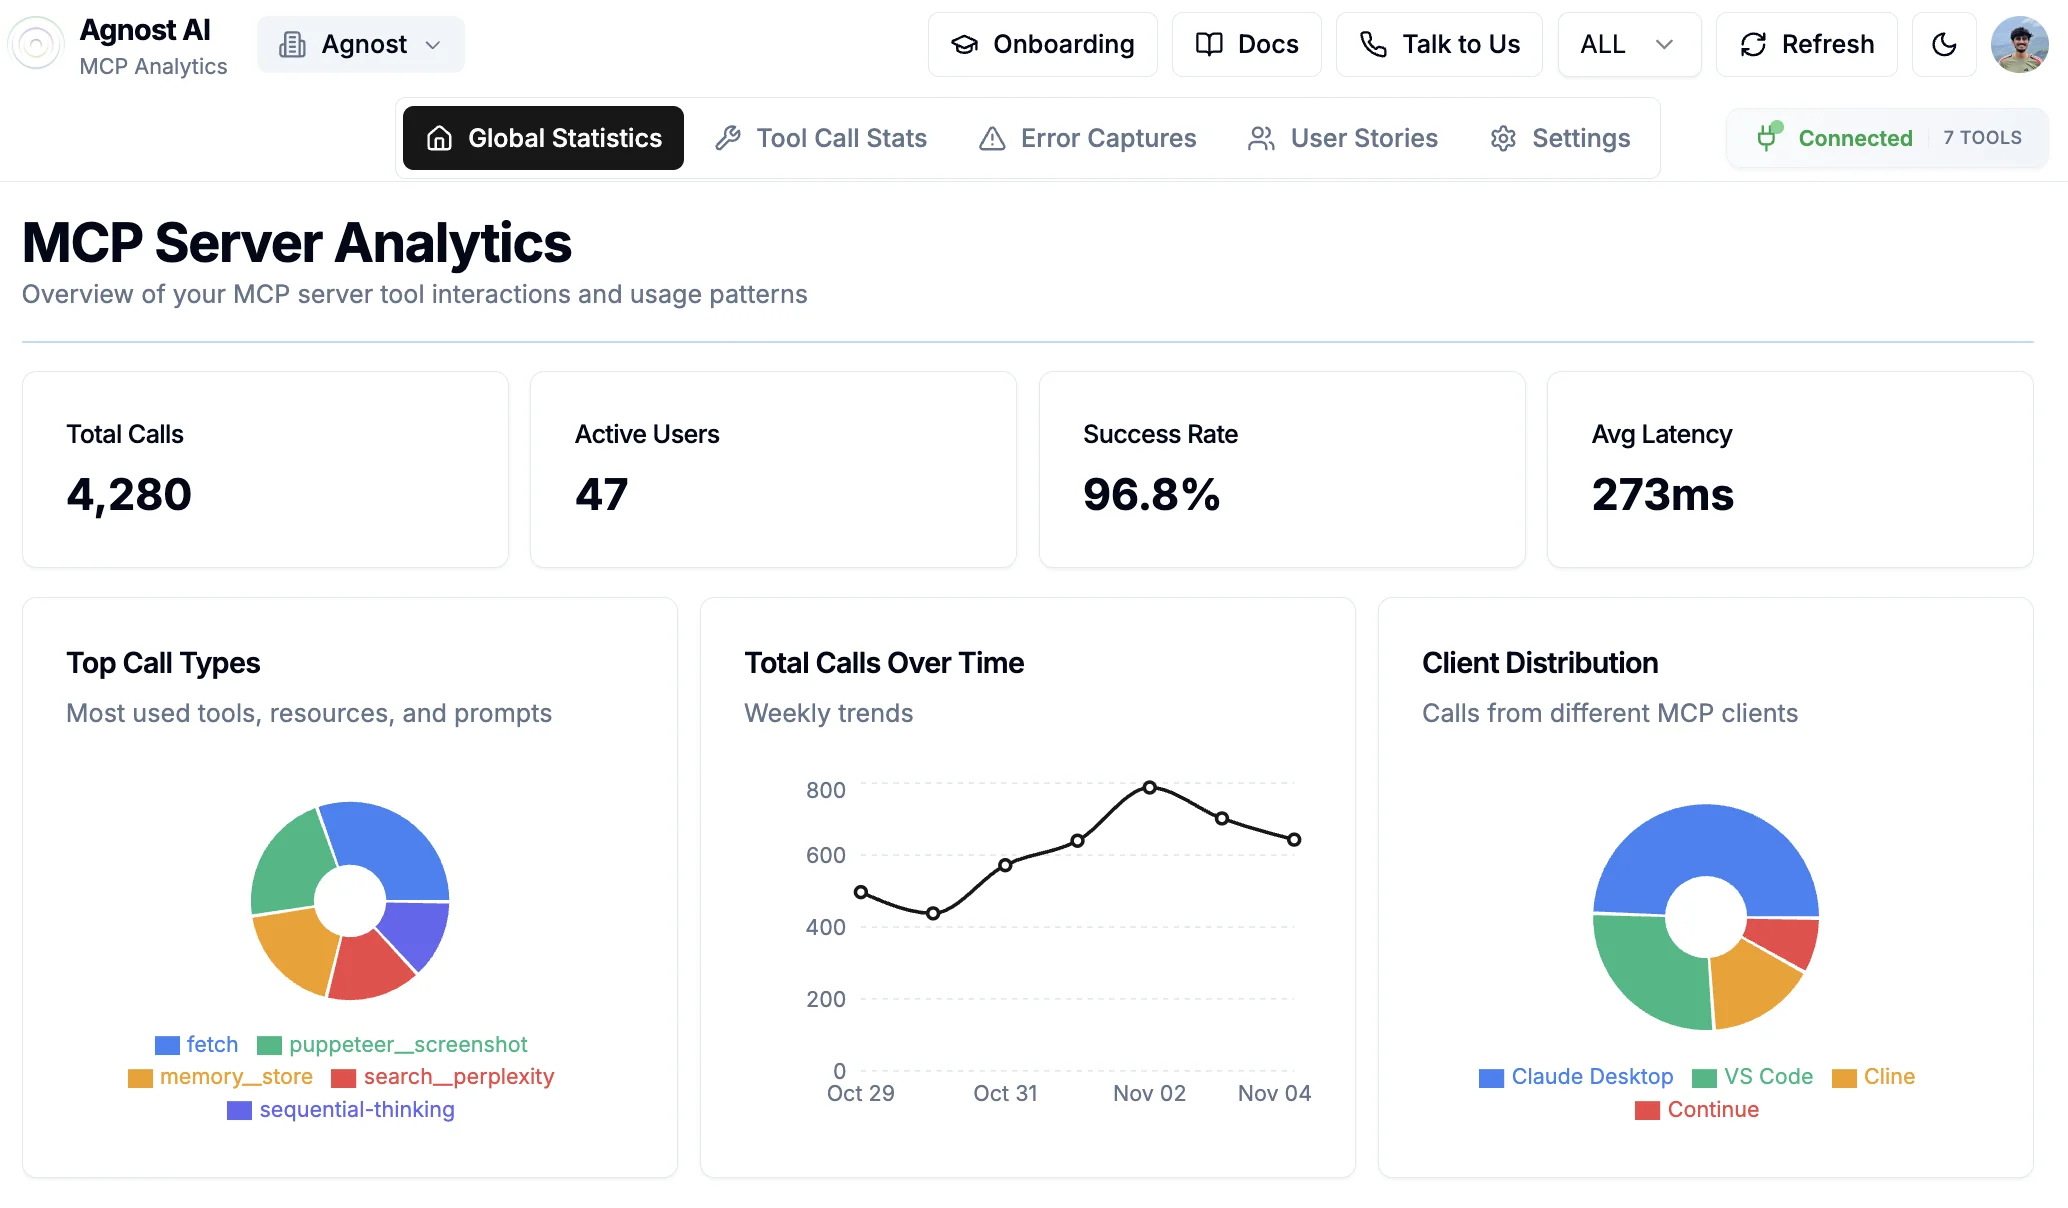
Different AI clients have different usage patterns. The Client Distribution chart shows where your MCP traffic is coming from—Claude Desktop, VS Code, Cline, Continue, or other MCP-compatible applications.
This helps teams understand which clients to optimize for and where to focus integration efforts. If 60% of your users are on Claude Desktop but you've only tested in VS Code, Agnost makes that gap visible.
Real-world scenario: debugging a production MCP server
Consider a scenario where your team has deployed an MCP server that provides filesystem access, web search, and database querying capabilities to AI applications. Users report that "sometimes it's slow," but you lack the data to diagnose the issue.
With Agnost instrumented, you can:
The instrumentation provides the data needed to identify and address the performance issue.
Integration options
Agnost currently supports Python MCP servers with three simple steps.
TypeScript and Go support are on the roadmap. The platform is designed to work with any MCP server implementation, whether you're using the official SDKs or custom implementations.
The instrumentation is non-blocking and designed for production use. Failed telemetry transmissions don't impact your server's functionality—if Agnost is unreachable, your MCP server continues operating normally.
Getting started
Agnost offers a hosted dashboard at app.agnost.ai where you can view analytics, configure alerts, and export data. The onboarding flow provides your unique organization ID, which you use in the track() function.
Once connected, you'll see real-time data flowing into the dashboard. No additional configuration is required for basic monitoring, though you can customize alerts, set up integrations, and configure user tracking based on your needs.
The team behind Agnost built the platform while working on AI applications at Entrepreneurs First and experiencing the observability gap firsthand. They're actively developing new features based on feedback from early adopters.
MCP observability
As MCP servers move into production environments, understanding usage patterns, diagnosing performance issues, and responding to errors becomes more important.
Agnost treats MCP as a first-class protocol, understanding tool semantics, user journeys, and error patterns specific to AI applications. The one-line integration makes it straightforward to instrument servers, and the unified dashboard consolidates monitoring in one place.
For teams managing MCP deployments, visibility into server behavior provides a foundation for building reliable AI applications.
Learn more about Agnost AI at agnost.ai or get started with the documentation.