Analytics
See active users, new and returning users, and organization engagement for your AuthKit app.
AuthKit Analytics is a dashboard built into AuthKit that shows how people use your app. Because AuthKit already handles every sign-in and session, the data is available without adding a tracking script or third-party analytics tool.
You can use it to:
- Track daily, weekly, and monthly active users.
- Compare new users with returning users over time.
- See which organizations are most active and where new users are coming from.
- Cross-check the numbers reported by your own analytics tooling.
To view it, go to Authentication → Analytics in the WorkOS Dashboard.
AuthKit records an analytics event when a user’s session is created, such as when they sign in, and when a session is refreshed. To keep the data compact, AuthKit records at most one created event and one refreshed event per session per day (UTC), so a session’s later refreshes on the same day don’t appear separately in hourly charts. Analytics are scoped to an environment and include activity from every application in that environment.
A user is active in a time period if they have at least one session created or refreshed during that period. Each user is counted once per period, no matter how many sessions or devices they use.
Because session refreshes count as activity, a user who stays signed in and keeps using your app is counted as active even if they haven’t entered their credentials during the period.
Every active user is either new or returning:
- New users are users who were created during the selected time period and were active during it.
- Returning users are users who were created before the selected time period and were active during it.
The total number of active users is the sum of new and returning users.
Each metric shows the percentage change from the previous time period of the same length. For example, when viewing the last 7 days, the comparison is with the 7 days before that.
The Active users section shows the total, new, and returning user counts for the selected time period, along with a chart of how those numbers change over time.
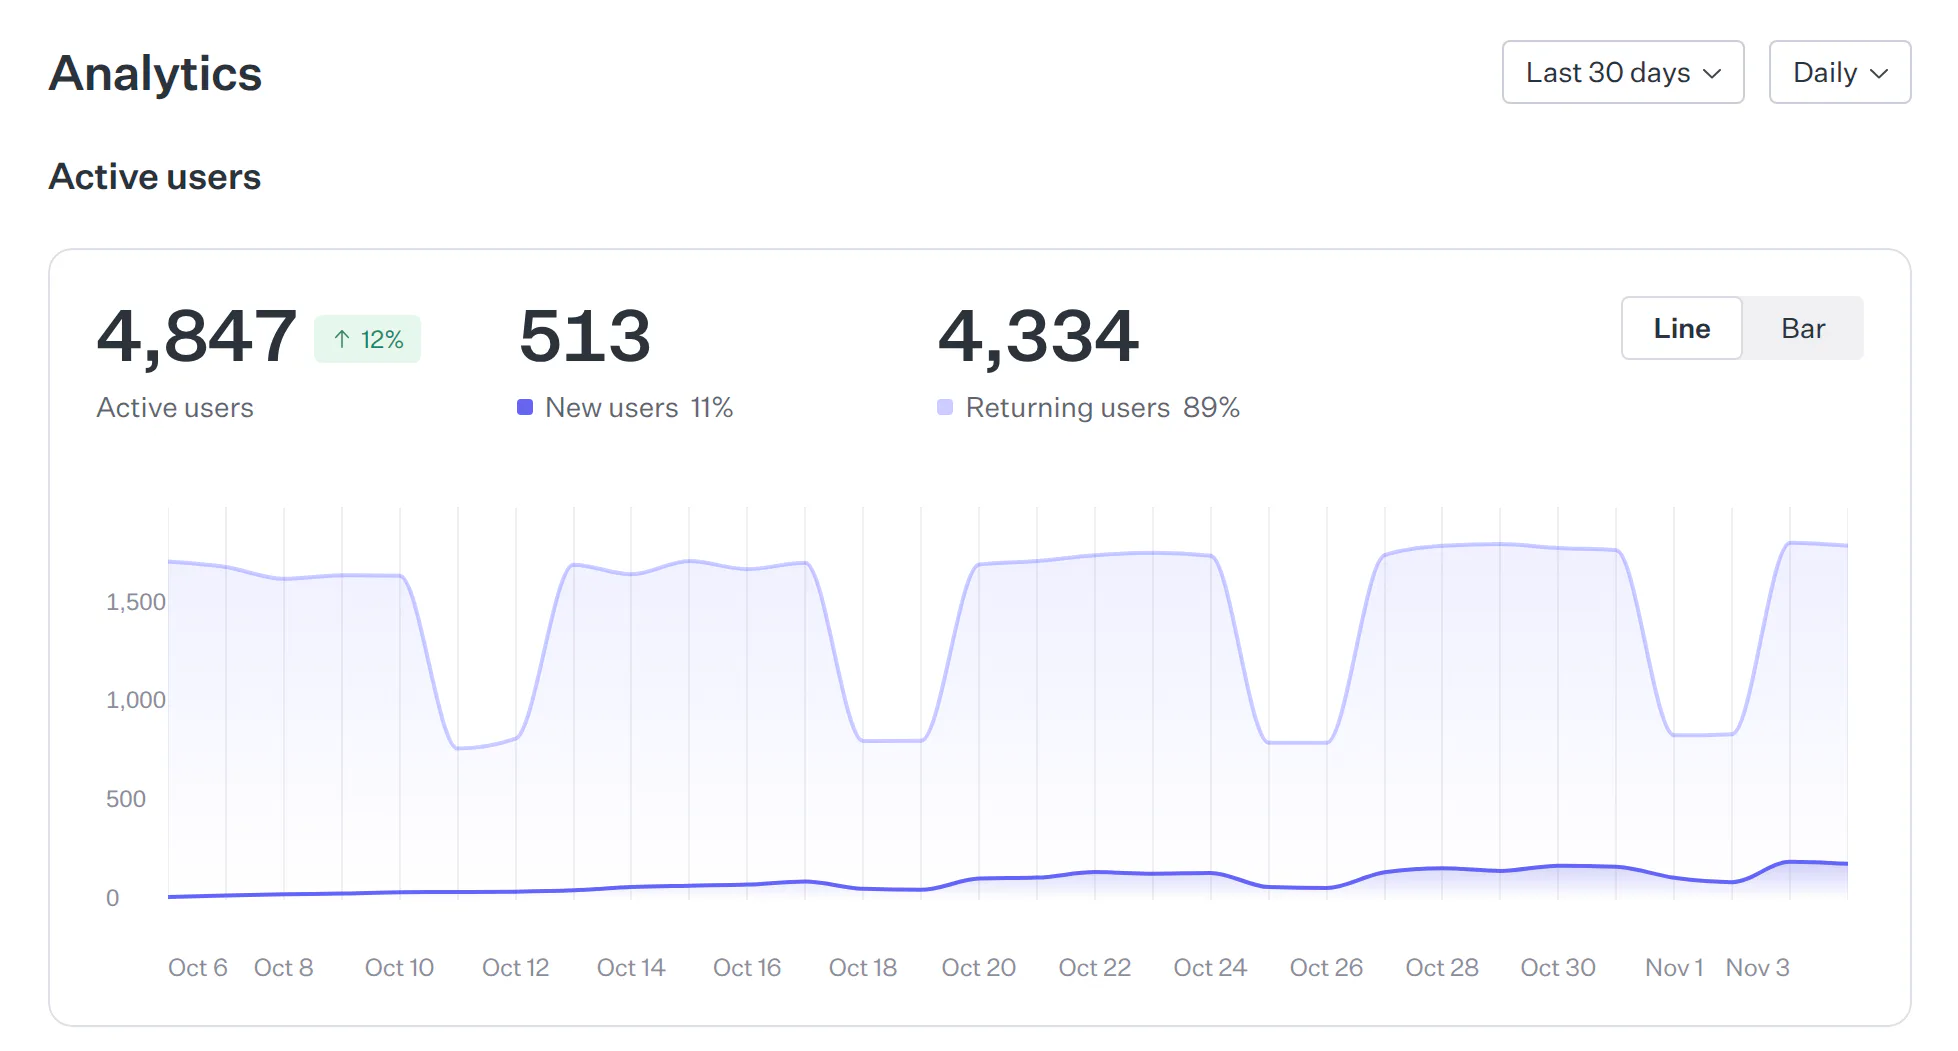
The percentage next to the total compares it with the previous period of the same length. For example, when viewing the last 30 days, the comparison is with the 30 days before that.
Use the controls at the top of the page to choose a time period and interval:
| Time period | Available intervals |
|---|---|
| Last 24 hours | Hourly |
| Last 7 days | Daily, hourly |
| Last 30 days | Daily, weekly |
| Last 30-60 days | Daily, weekly |
| Last 3 months | Weekly, monthly |
Switch between a line chart and a stacked bar chart with the toggle above the chart. Hover over any point to see the new and returning users for that interval. The bar chart is not available for the last 7 days at an hourly interval.
Dates and times are shown in your browser’s time zone. The selected time period, interval, and chart type are saved in the page URL, so you can bookmark or share a specific view.
The Active organizations table breaks down activity by organization, so you can see which customers are growing, which have stalled, and which are signing up new users but not coming back.
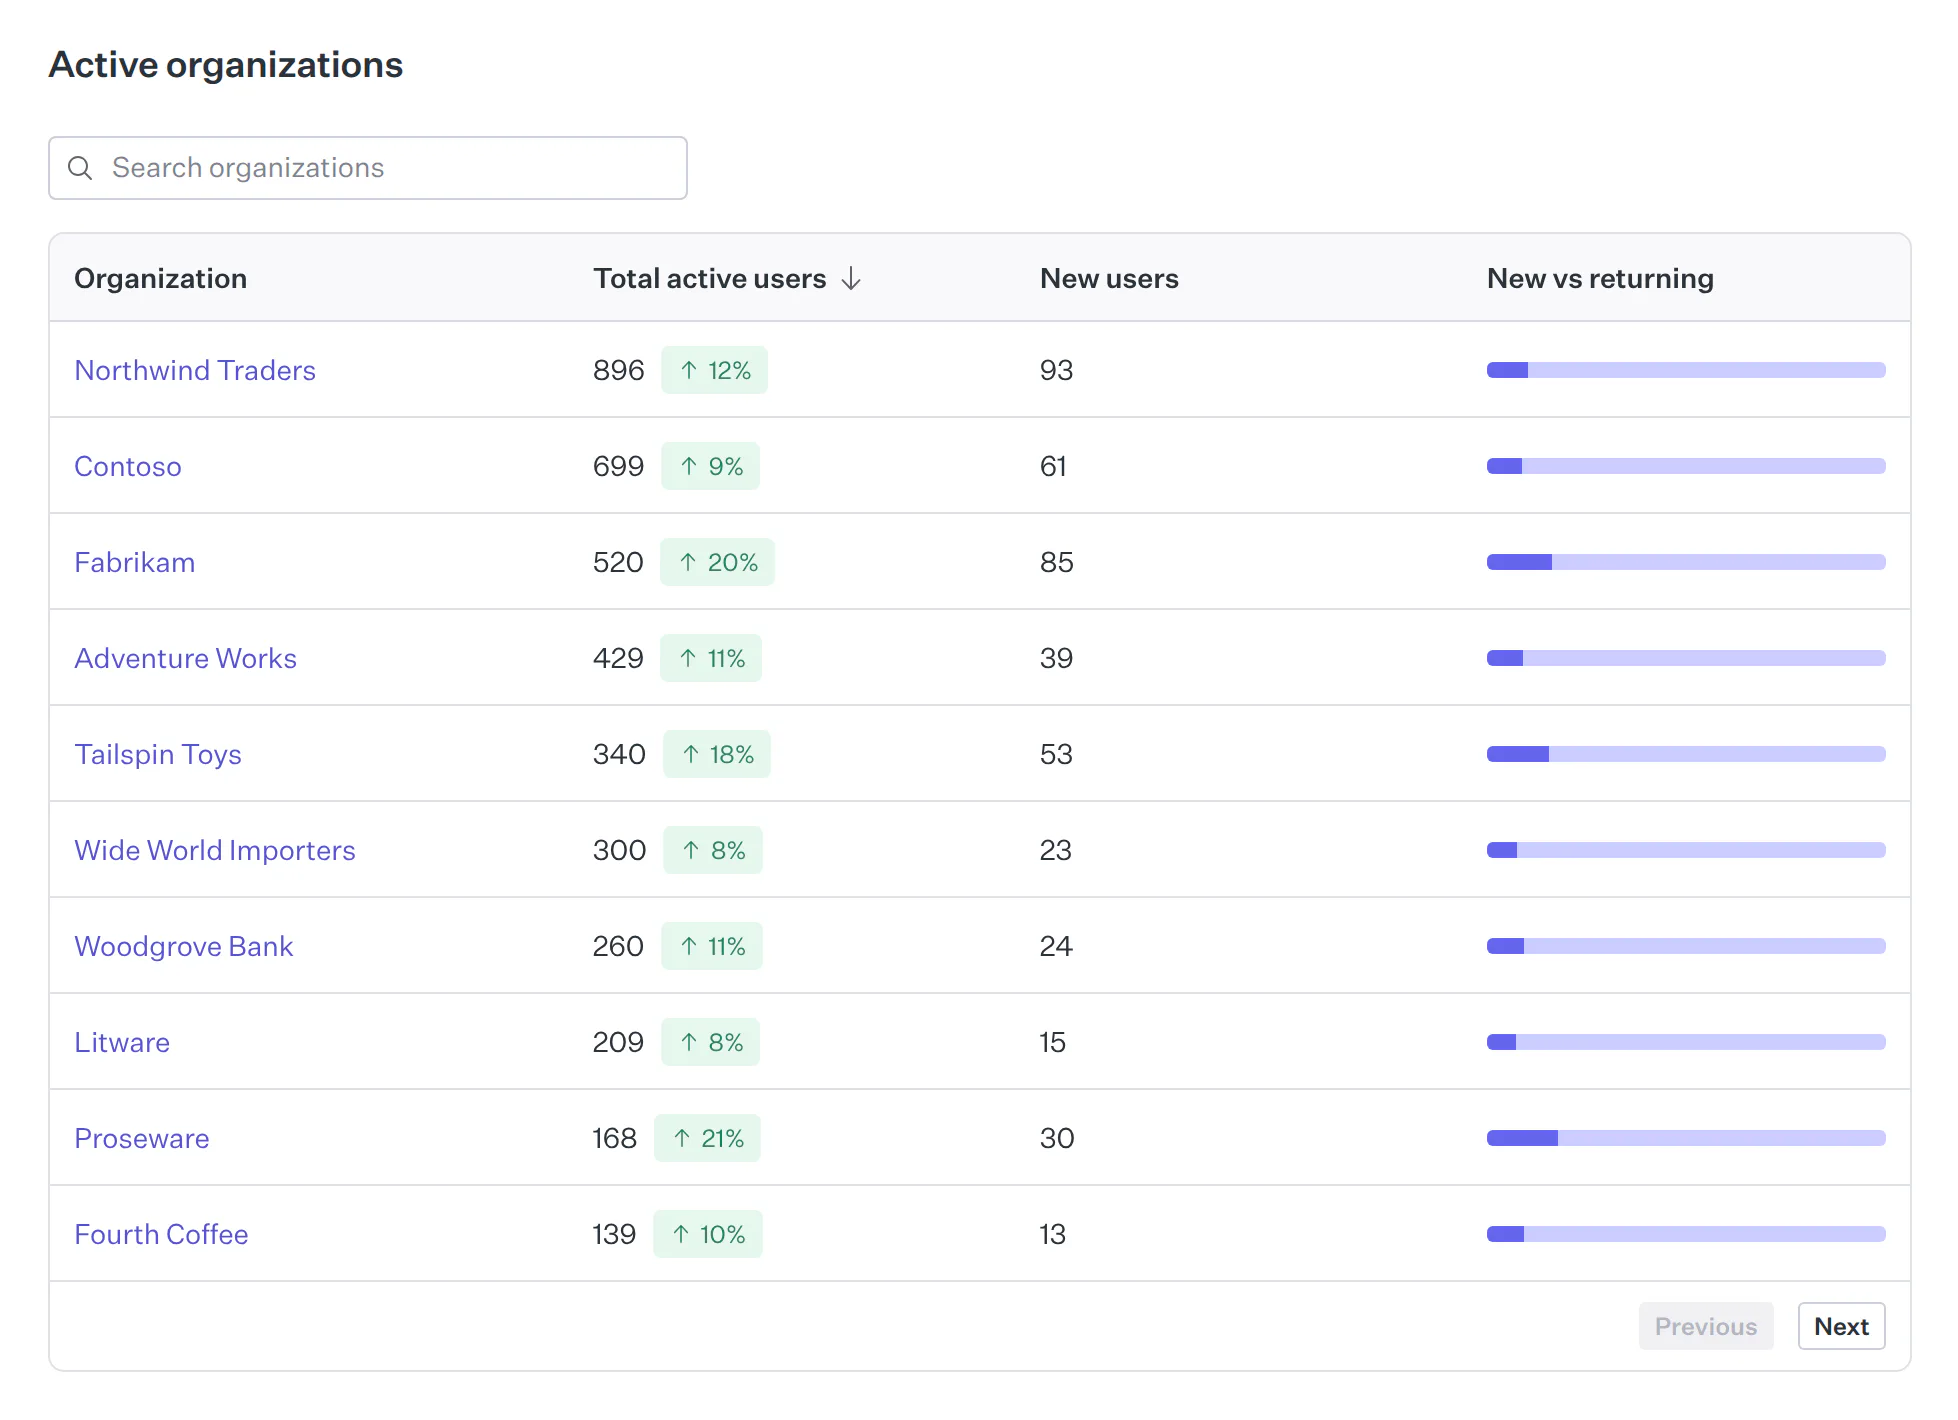
For each organization, the table shows:
- Total active users – the number of users active in the organization during the selected time period.
- New users – the number of those users who were created during the time period.
- New vs returning – the share of active users who are new or returning. Hover over the bar to see the counts.
The percentage next to each organization’s total compares it with the previous period of the same length.
By default, the table lists the 10 most active organizations. Sort by total active users or new users, or search by organization name to find a specific organization.
Activity is attributed to the organization that a user’s session belongs to. Sessions without an organization count toward the environment’s active users but not toward any organization.
Analytics data is cached for about a minute, so new sign-ins are included shortly after they happen. The page doesn’t update on its own; reload it or change the time range to see the latest numbers.
- To send AuthKit activity to your own analytics tools, see the Google Analytics and Segment add-ons.
- To learn more about sessions, see Sessions.